🚀 A CloudSEK se torna a primeira empresa de segurança cibernética de origem indiana a receber investimentos da
Leia mais
.avif)

Key risk indicator (KRI) is a measurable metric that signals when an organization's risk exposure is rising toward or beyond the level it is prepared to accept. KRIs act as early warning signals, flagging a developing problem while there is still time to act rather than after a loss has occurred.
Their importance tracks the risk environment leaders now face. In the NC State University and Protiviti Executive Perspectives on Top Risks survey of 1,215 board members and C-suite executives worldwide, cyber threats and data breaches rank as the second highest near-term risk, and third-party and supply chain risk ranks seventh. KRIs are how organizations turn concerns like these into monitored metrics with defined thresholds and clear owners.
A simple example: for a retail business, a rising number of customer complaints can indicate a developing operational or quality problem. For a security team, a growing count of internet-facing assets can indicate an expanding external attack surface. In each case the metric reflects exposure, and a defined threshold marks the point where that exposure needs a response.
Without early warning, organizations tend to discover risks only after they materialize as financial loss, regulatory action, or reputational damage. Forrester's The State of Enterprise Risk Management, 2025 found that nearly 75% of enterprises experienced at least one critical risk event in the past year, which shows how routinely exposure turns into impact.
KRIs narrow that gap in several ways:
The shared purpose is time. The earlier a risk becomes visible, the cheaper and easier it is to contain.
KRIs are frequently confused with key performance indicators (KPIs), and both are distinct from key control indicators (KCIs). The three measure different things and work well together.
A KPI and a KRI are often complementary. Full patch coverage is a performance goal (KPI), while the share of systems left unpatched is the matching risk indicator (KRI). Defining one frequently surfaces the other.
KRIs fall into two broad types based on when they signal risk relative to an event.
Leading indicators are predictive. They change before a risk event occurs, giving time to intervene. Examples include a rising number of failed login attempts, growing dependence on a single supplier, or an increasing count of unpatched vulnerabilities. Leading indicators carry the highest preventive value, since they point to a risk that has not yet materialized.
Lagging indicators are measured after an event. They confirm that a risk materialized and help quantify its effect. Examples include the number of security incidents last quarter or the count of audit findings. Lagging indicators support trend analysis and validate whether controls and leading indicators are working.
Effective programs combine the two: leading indicators to anticipate risk, and lagging indicators to confirm patterns and calibrate thresholds.
A KRI delivers value only when it is well constructed. Effective KRIs share a consistent set of traits:
Building a KRI program follows a clear sequence, from understanding the risks to monitoring the metrics that track them.
A KRI becomes useful when it is paired with thresholds that define when a value is acceptable, when it warrants attention, and when it demands action. A common approach uses three bands:
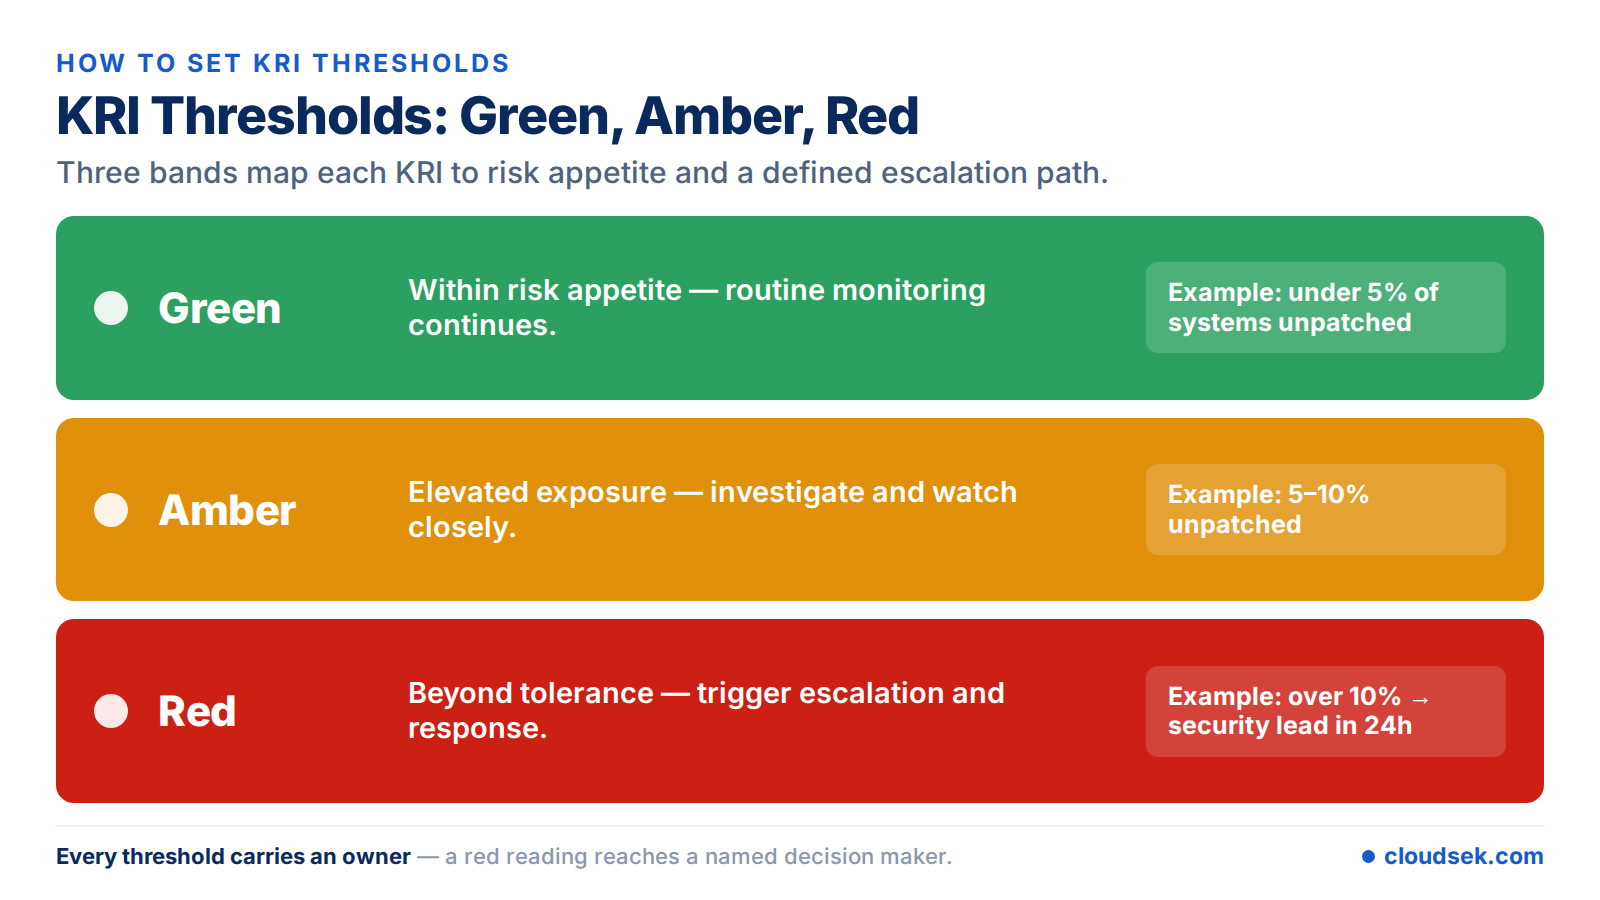
Thresholds map to the organization's risk appetite and carry a defined escalation path, so a red reading reaches a named decision maker. For example, a KRI tracking unpatched critical vulnerabilities could set green below 5% of systems, amber between 5% and 10%, and red above 10%, with a red reading escalated to the security lead within 24 hours.
KRIs vary by industry and risk profile. The examples below show common KRIs by category with sample measurement points. Organizations calibrate the exact numbers to their own risk appetite.
Cybersecurity ranks among the top risks leaders track, which makes cyber KRIs a core part of most programs. Because a large share of the relevant exposure sits outside the network perimeter, several effective cyber KRIs measure external conditions.
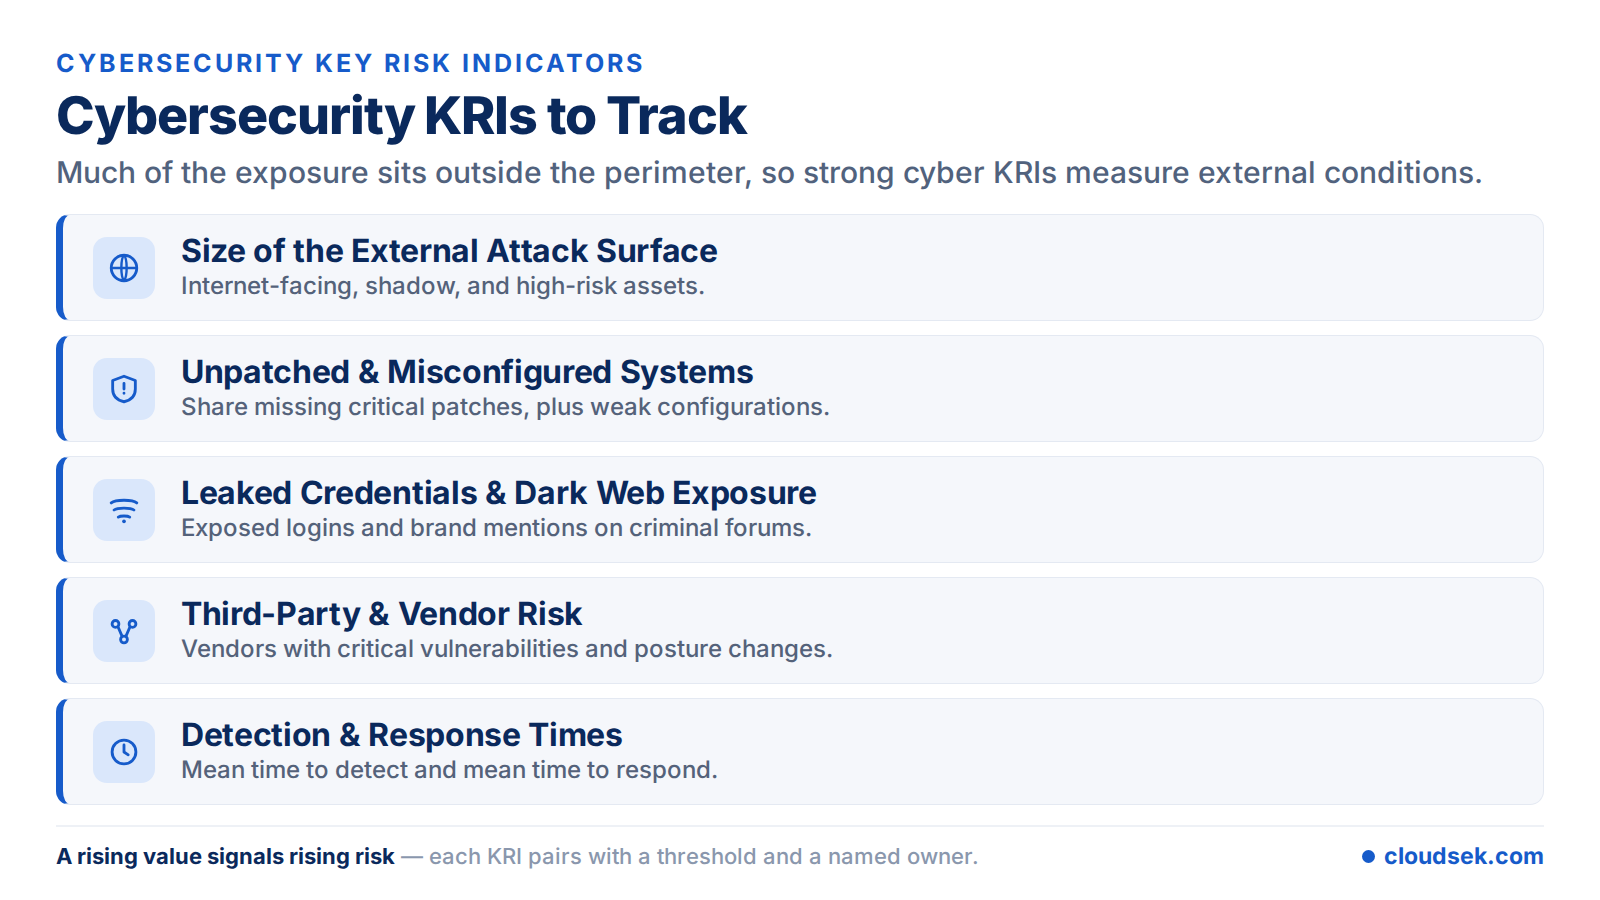
The count of internet-facing assets, unknown or shadow assets, and high-risk exposures. A sudden rise can indicate uncontrolled growth that widens the ground an attacker can target, which is why cyber asset attack surface management treats asset discovery as a continuous activity.
The share of systems is missing critical patches, along with weak encryption settings and misconfigurations. Poor patching cadence correlates with higher breach and ransomware likelihood, and ongoing external vulnerability scanning keeps this indicator current.
The number of employee or customer credentials exposed in breach dumps or surfacing through dark web monitoring, plus mentions of the brand on criminal forums. Tracking leaked credentials turns a hidden exposure into a measurable signal of account-takeover risk.
The number of vendors with critical vulnerabilities, changes in a vendor's security posture, and concentration on a small set of critical suppliers. These indicators give early warning of a supply chain attack reaching the organization through a trusted partner.
Mean time to detect and mean time to respond. A rising mean time to detect signals, weakening monitoring, while improving detection accuracy, shortens the window an attacker operates in.
KRIs are a core component of an enterprise risk management (ERM) program. Within an ERM framework, identified risks are recorded in a risk register, assessed for likelihood and impact, and assigned KRIs that track how each risk trends over time.
KRIs feed risk dashboards and board reporting, connecting day-to-day metrics to the organization's risk appetite. Frameworks such as COSO ERM and ISO 31000 treat ongoing monitoring as a continuous requirement, and KRIs are the practical mechanism that makes that monitoring measurable.
Common pitfalls mirror these practices in reverse: tracking too many metrics, defining KRIs without thresholds, relying on stale data, and leaving indicators without a clear owner.
A key risk indicator is a metric that gives an early warning that a specific risk is becoming more likely or more severe. It tracks exposure against a threshold, so a rising value signals the need to act before a loss occurs.
A KRI measures exposure to a potential risk, while a KPI measures progress toward a goal. KRIs are forward-looking warnings, and KPIs report on performance. The two are complementary, and one often has a matching counterpart.
The percentage of systems missing critical security patches is a common KRI because a rising value signals growing breach exposure. Other examples include employee turnover rate, liquidity ratio, and the number of leaked credentials found on the dark web.
A leading KRI signals risk before an event occurs, such as a rise in failed logins. A lagging KRI measures risk after the fact, such as the number of incidents last quarter. Leading indicators support prevention, and lagging ones confirm trends.
There is no fixed number, but most organizations track a focused set tied to their top risks rather than dozens of metrics. A smaller group of well-chosen, threshold-based KRIs with clear owners proves more useful than broad coverage.
A KRI threshold is the value that defines when a risk metric moves from acceptable to elevated or unacceptable. Many programs use green, amber, and red bands tied to risk appetite, with a red reading triggering escalation to a named owner.
