What are Attack Graphs? Components, How They Work, and Use Cases

An attack graph maps how an attacker moves through a network to reach critical assets. Learn the components, types, use cases, and how attack graphs work.
Published on
Sunday, July 12, 2026
Updated on
July 12, 2026

An attack graph is a model that maps how an attacker could move through a network, showing the systems, vulnerabilities, and paths that connect an entry point to a critical asset. Attack graphs help security teams predict and disrupt attack paths before execution.

The shift toward this approach is well documented. Gartner introduced continuous threat exposure management in 2022 and predicts that organizations prioritizing it will be three times less likely to suffer a breach by 2026. Attack graphs sit at the center of that shift, turning isolated vulnerability lists into the connected attack paths an attacker would actually follow.

This guide explains what attack graphs are, the components that make them up, and how they work. It covers attack graphs versus attack trees and attack paths, the main types, how to build one, the benefits, use cases, best practices, and the limitations to plan around.

What are Attack Graphs?

An attack graph is a graphical model of the routes an attacker could take through an environment to reach a target. Nodes represent systems, conditions, or vulnerabilities, and edges represent the exploits or actions that move an attacker from one state to the next. The graph turns a list of separate weaknesses into a connected map of how those weaknesses chain together.

Attack graphs answer a question that vulnerability scans cannot. A scan reports which flaws exist, while an attack graph shows which flaws sit on a path to something that matters. That distinction lets teams focus on the exposures that actually lead to a breach.

Four traits define an attack graph:

  • Path-modeling: it maps multi-step routes, not single flaws.
  • Relationship-aware: it shows how systems and exposures connect.
  • Predictive: it anticipates attacker movement before an attack.
  • Prioritization-enabling: it ranks exposures by their place on a path.

Components of an Attack Graph

An attack graph is built from five components:

Component What it Represents
Nodes Systems, conditions, privileges, or vulnerabilities in the environment.
Edges The exploits or actions that move an attacker between nodes.
State Information The current status of each node, such as open ports, running services, or whether it is compromised.
Attack Actions The specific techniques used to exploit a node, such as privilege escalation or lateral movement.
Constraints The preconditions that must hold for an action to succeed, such as an open port or valid credentials.

These components combine into a working model: nodes and edges form the structure, while state information, attack actions, and constraints make the paths realistic rather than theoretical.

How Attack Graphs Work

An attack graph works by modeling how an attacker chains exposures into a route toward a target. It identifies entry points, simulates the paths that lead deeper into the environment, assesses which vulnerabilities sit on those paths, and highlights where to break the chain. The result shows not just where weaknesses exist, but which ones an attacker would actually use.

An attack graph performs four functions:

  • Identify entry points: it maps where an attacker could first gain access.
  • Simulate attack paths: it models the routes from each entry point toward critical assets.
  • Assess vulnerabilities: it shows which weaknesses sit on a real path, not just which ones exist.
  • Prioritize defenses: it points to the choke points where one fix breaks many paths.
sample attack graph

A sample attack graph: two entry paths converge at a choke point before reaching the critical asset.

Points where many paths converge are choke points. A single fix at a choke point can break multiple attack paths at once, which makes choke points the highest-value place to focus defense.

A worked example shows the pattern. An attacker exploits an exposed web server to gain a foothold, then moves to a workstation through a phishing payload and to a file server through a shared credential. Both routes converge on a domain admin account, which unlocks the critical database. The graph reveals that securing the domain admin account, the choke point, breaks both paths before the attacker reaches the data.

Attack Graph vs Attack Tree vs Attack Path

Attack graphs, attack trees, and attack paths are related but distinct. An attack graph models many interconnected routes across an environment. An attack tree breaks a single attacker goal into a hierarchy of sub-goals and steps. An attack path is one route through the graph, from entry to target.

attack graph vs tree vs path

An attack graph maps many converging routes, an attack tree breaks one goal into a hierarchy, and an attack path is a single route through the graph.

Aspect Attack Graph Attack Tree Attack Path
Structure Interconnected nodes and edges. Hierarchical, goal at the root. A single chain of steps.
Scope A whole network. One attacker goal. One route to one target.
Best Use Mapping real enterprise networks. High-level threat modeling. Describing or testing one scenario.

In practice, teams use attack trees to reason about a single goal, attack graphs to map a whole environment, and attack paths to describe or test the specific routes the graph reveals.

Types of Attack Graphs

Attack graphs fall into a few common types, grouped by what their nodes represent and how they are produced:

  • State-based graphs: nodes represent network states, and edges represent exploits that move the network into a more compromised state.
  • Condition or dependency graphs: nodes represent the pre-conditions and post-conditions of an exploit, and edges represent the dependencies between them.
  • Manual graphs: drawn by hand by red teams, accurate but slow and hard to scale.
  • Automated graphs: generated by tooling that ingests scan and configuration data, scaling to large and changing networks.

Most enterprise programs now favor automated, continuously updated graphs over static ones, because networks change faster than a manual graph can track.

How to Build an Attack Graph

Building an attack graph follows five steps:
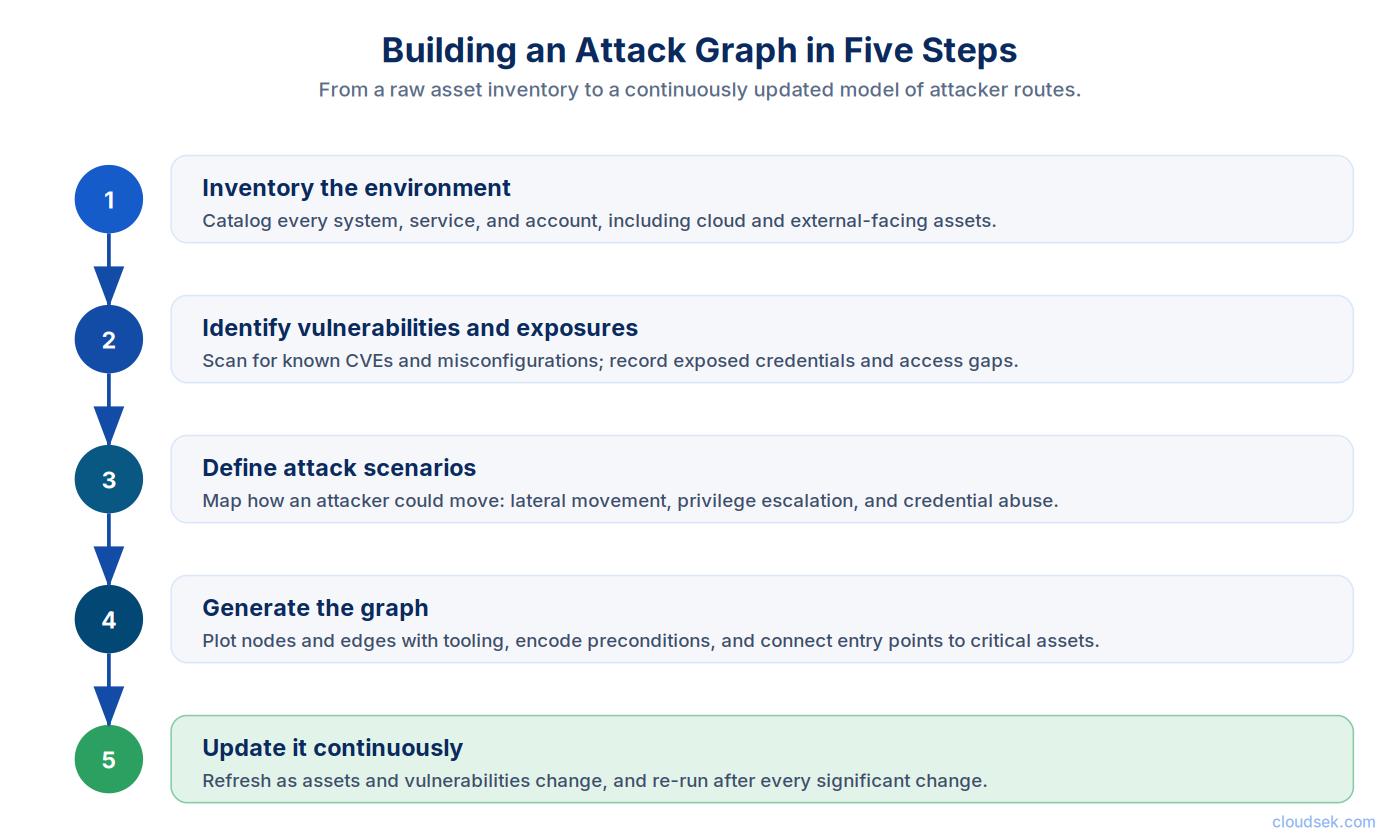
how to build an attack graph
  1. Inventory the environment. First, catalog every asset that could appear on a path.
  • List systems, services, and accounts.
  • Include cloud and external-facing assets.
  1. Identify vulnerabilities and exposures. Second, find the weaknesses attackers could use.
  • Scan for known CVEs and misconfigurations.
  • Record exposed credentials and access gaps.
  1. Define attack scenarios. Third, map how an attacker could move from each entry point.
  • Include lateral movement and privilege escalation.
  • Consider phishing, exploitation, and credential abuse.
  1. Generate the graph. Fourth, plot the nodes and edges with tooling.
  • Encode the preconditions each action requires.
  • Connect entry points to critical assets.
  1. Update it continuously. Fifth, keep the graph current as the environment changes.
  • Refresh as assets and vulnerabilities change.
  • Re-run after major configuration changes.

Why Attack Graphs Matter

Attack graphs give security teams these five key advantages:

  • Proactive path discovery: they reveal attack routes before an attacker finds them. A team sees the chain from exposure to a critical asset while there is still time to break it.
  • Risk-based prioritization: they rank exposures by their place on a path to critical assets. A flaw on a route to a database matters more than the same flaw on an isolated host.
  • Better resource allocation: they focus effort on choke points instead of every flaw. One fix at a convergence point can close many paths at once.
  • Faster incident response: they show how an in-progress attack could spread. Responders see which systems to contain first and where the attacker is likely headed.
  • Clearer risk communication: they translate technical exposures into a picture leaders can act on. A graph makes the path to a breach legible to a board, not just a security team.

Use Cases of Attack Graphs

Attack graphs support four common use cases:

  • Penetration testing and red teaming: testers use graphs to plan realistic multi-step attacks, a practice red teams once did by hand. The graph surfaces paths a single-vulnerability test would miss.
  • Incident response: responders use graphs to trace how an attack could spread and decide what to contain first. The graph turns a live alert into a map of likely next moves.
  • Vulnerability and exposure prioritization: teams patch the flaws that sit on real attack paths first. The graph separates the few exposures that enable a breach from the many that do not.
  • Threat modeling: graphs map to MITRE ATT&CK techniques to connect exposures to known attacker behavior. The mapping shows whether current detection covers the techniques on each path.

Best Practices for Attack Graphs

Five best practices keep an attack graph accurate and useful:

  1. Base graphs on accurate data. First, feed the graph current data about the environment.
  • Use up-to-date asset, CVE, and configuration data.
  • Automate ingestion to avoid a stale graph.
  1. Model preconditions correctly. Second, capture what each exploit actually requires.
  • Encode the access and configuration each action needs.
  • Account for segmentation and access controls.
  1. Integrate with threat modeling. Third, align the graph with attacker behavior.
  • Map each path to known adversary techniques.
  • Align with the organization's threat models.
  1. Add risk and probability scores. Fourth, weight paths so teams act on the worst first.
  • Annotate paths with CVSS and exploit availability.
  • Weight each path by asset criticality.
  1. Validate with testing. Fifth, confirm the graph reflects reality.
  • Use graphs to guide red team exercises.
  • Confirm that controls break critical paths.

Challenges and Limitations of Attack Graphs

Attack graphs carry several limitations to plan around:

  • State explosion: large networks produce graphs so big they become hard to compute and read, which forces teams to scope the graph to what matters.
  • Data dependence: a graph is only as accurate as the asset and vulnerability data behind it, so stale data produces a misleading map.
  • Manual effort: building graphs by hand does not scale, which pushes teams toward automated generation.
  • False paths: missing preconditions can suggest attack routes that do not actually exist, wasting effort on paths an attacker could not take.
  • Specialized expertise: building and reading graphs takes skill, and the output can overwhelm teams without tooling that highlights the paths that matter.

Attack Graphs in Predictive Exposure Management

Attack graphs have moved from static diagrams to continuous, automated models. Modern programs generate them from live data and refresh them as the environment changes, which fits the continuous threat exposure management (CTEM) approach now standard in exposure programs.

The newest systems use AI to correlate signals from many sources into predictive attack graphs. Rather than mapping a network once, they continuously predict how an attacker would chain exposures into a path, so teams disrupt the path before execution rather than after a breach.

The CTEM framework runs in five stages: scoping, discovery, prioritization, validation, and mobilization. Attack graphs feed the prioritization and validation stages, showing which exposures sit on a real path and confirming whether existing controls break it.

How CloudSEK Nexus AI Builds Predictive Attack Graphs

CloudSEK Nexus AI is an attack path intelligence layer that correlates signals from across CloudSEK's platform into predictive attack graphs. It ingests digital risk and dark web exposure, threat actor and CVE intelligence, the external attack surface, the AI attack surface, and third-party risk, then maps how an attacker would chain those signals into a real, executable attack path.

Nexus AI builds its attack graph from external, AI, and third-party signals, focused on the initial access vector and how attackers get in, rather than mapping internal host-by-host movement. It scores each path by exploitability and attacker behavior, so security teams disrupt attack chains across the AI attack surface and beyond before they execute.

CloudSEK's research shows how a predictive attack graph forms in practice. In one published finding, AIVigil discovered an unauthenticated MCP server on a customer's AI attack surface. An attacker could enumerate its exposed tools and chain them into server-side request forgery, local file inclusion, and the theft of live AWS credentials. Nexus AI correlates that AI-layer entry point with related signals, such as a leaked credential or an exposed vendor, into a single attack graph that shows the full path to the data rather than three disconnected alerts.

Frequently Asked Questions

What is an attack graph?

An attack graph is a model that maps how an attacker could move through a network, showing the systems, vulnerabilities, and paths that connect an entry point to a critical asset.

What is the difference between an attack graph and an attack tree?

An attack graph models many interconnected attack routes across a network, while an attack tree breaks a single attacker goal into a hierarchy of sub-goals and steps.

What are the components of an attack graph?

An attack graph is built from nodes, edges, state information, attack actions, and constraints.

How are attack graphs generated?

Attack graphs are generated manually by red teams or automatically by tools that ingest asset, vulnerability, and configuration data and model the paths between nodes.

What is a choke point in an attack graph?

A choke point is a node where many attack paths converge, so fixing it breaks multiple paths at once.

Can attack graphs be automated?

Yes. Attack graphs can be generated and updated automatically by tools that ingest live data, which scales the technique to large and changing networks.

Related Posts
How Does a Threat Intelligence Platform Support SOC Teams?
Threat intelligence platforms support SOC teams by enriching alerts, improving detection accuracy, and accelerating incident response.
What are Indicators of Compromise (IoCs) in Cybersecurity?
Indicators of Compromise (IoCs) are digital clues like IPs, hashes, and logs that reveal cyberattacks and help detect and respond to threats.
What are Attack Graphs? Components, How They Work, and Use Cases
An attack graph maps how an attacker moves through a network to reach critical assets. Learn the components, types, use cases, and how attack graphs work.

Start your demo now!

Schedule a Demo
Free 7-day trial
No Commitments
100% value guaranteed

Related Knowledge Base Articles

No items found.