🚀 CloudSEK featured in the 2026 Frost Radar™!
Read more
.avif)

Attack path analysis (APA) is the practice of identifying, mapping, and prioritizing the chained routes an attacker follows from an entry point to an organization's critical assets.
The analysis connects vulnerabilities, misconfigurations, identities, and permissions that look minor in isolation into the sequences that lead somewhere dangerous.
Vulnerability scanners report findings one at a time, each scored on its own. Attack path analysis asks a different question: which combination of findings lets an outsider reach a domain controller, a customer database, or a cloud tenant, and which single fix breaks that route.
Attack path analysis models an environment as a graph of assets and the relationships an attacker abuses to move between them.
A path exists only when every edge in the chain is traversable. Removing one edge, such as an unnecessary permission, breaks every path that runs through it, and that property drives the entire prioritization logic of the discipline.
These four terms describe different layers of the same problem, and attack path analysis connects them.
The external attack surface defines where an outsider starts, each attack path is one route through the environment, and an attack graph holds every route at once so analysis can rank them.
Most findings never become part of a real attack. Research behind FIRST's Exploit Prediction Scoring System found that only 2% to 7% of published vulnerabilities are ever observed exploited in the wild.
Organizations remediate only a fraction of their open findings each month, so picking the right fraction decides the outcome.
Severity scores (CVSS) alone cannot resolve which fraction to pick. A critical CVE on an isolated test server matters less than a medium-severity flaw on an internet-facing host holding credentials for a privileged account, and only path context reveals the difference.
Attack path analysis runs through four stages: discovery, graph mapping, path identification, and prioritization, repeated as the environment changes.
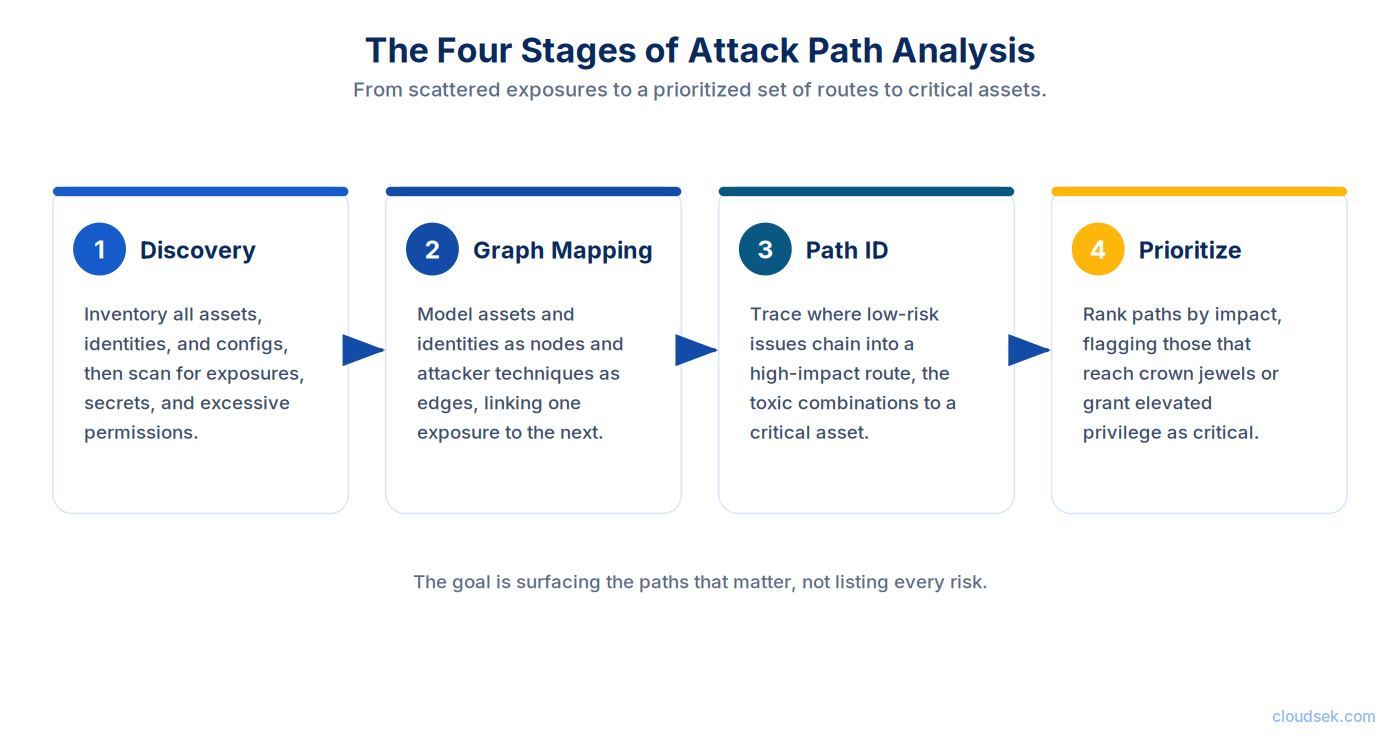
Discovery inventories assets, identities, configurations, and data across on-premises, cloud, identity, and external environments. Each resource is then assessed for vulnerabilities, exposed secrets, misconfigurations, and excessive permissions.
Data completeness sets the ceiling on everything that follows. Unknown internet-facing assets, unmanaged identities, and third-party connections that never reach the inventory become blind spots in the graph.
Findings become nodes, and relationships become edges: this host reaches that service, this user belongs to that group, this role can assume that one, this server caches that credential.
Edges map to attacker techniques in the MITRE ATT&CK framework, which keeps each step grounded in observed behavior.
Graph traversal finds every sequence of edges that connects an entry point to a crown jewel. Shortest-path and reachability queries answer which assets an attacker reaches from a given foothold, and how many steps each route takes.
Prioritization ranks paths by target value, number of steps, privilege gained, exploitability, and evidence of active exploitation. Exploitation evidence from threat intelligence separates a theoretical edge from one attackers use today, which is where threat analysis feeds the model.
Continuous re-analysis keeps that ranking accurate as the environment shifts. A new deployment, a permission change, or a newly exploited CVE opens paths that did not exist in last month's graph.
A choke point is a node or edge that many attack paths share on the way to critical assets. Fixing it breaks every path that runs through it.
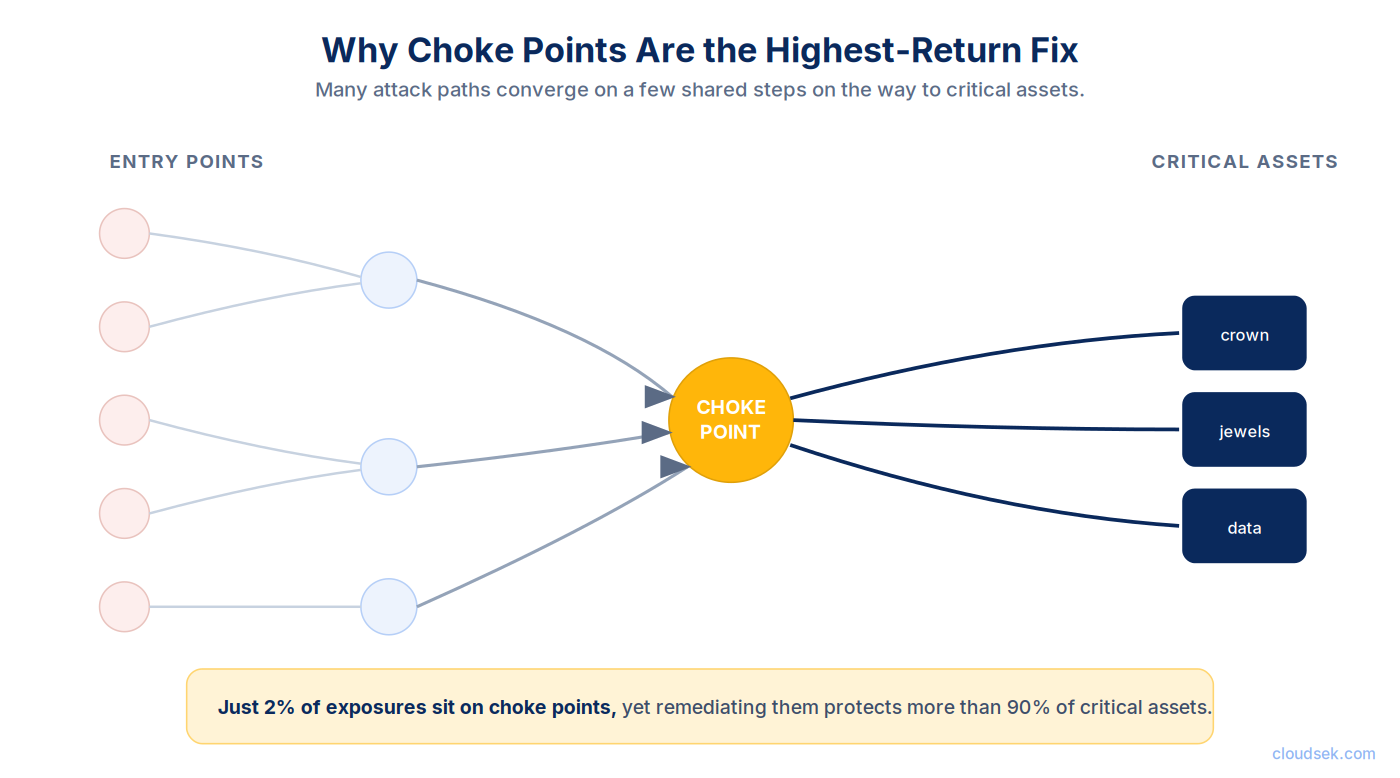
Graph analysis finds choke points through convergence: the nodes with the most paths passing through them, measured by metrics such as betweenness centrality. Common examples include an over-permissioned service account, a server where administrators log in, and a group granting broad write rights.
Choke points repay defensive attention in two separate ways. Remediation there removes many routes with a single change, and concentrated logging there catches attacker movement that scattered monitoring misses.
Identity relationships create attack paths that vulnerability scanners never report, because every account, group, role, and session is a potential edge.
The joint ASD, CISA, and NSA guidance on detecting and mitigating Active Directory compromises catalogs 17 common techniques and attributes Active Directory's exposure to permissive defaults, complex permission relationships, and legacy protocol support.
Open-source identity graph tools such as BloodHound map these relationships directly, and defenders run them for the same reason attackers do. The shortest route to domain administrator is rarely obvious from a permissions spreadsheet.
Three moderate findings in a cloud environment show how analysis surfaces a route that isolated scanning misses.
Scanned individually, each finding ranks as moderate on a severity scale. Connected, they form a complete route: exploit the workload, assume the identity, read the database. The over-privileged identity is the choke point, since reducing its permissions breaks the path even before the service is patched.
Some of the most damaging attack paths begin outside the organization entirely. CloudSEK's investigation of the LiteLLM supply chain breach traced one such route through AI infrastructure in 2026.
CloudSEK reconstructed exposure across more than 2,500 organizations and about 434,000 CI/CD pipelines, while cautioning that the figures describe potential credential exposure, not confirmed compromise at each organization.
Junctions carry the path analysis lesson here. An AI gateway holding credentials for many systems acts as a choke point in AI supply chain security.
Short-lived, narrowly scoped workload credentials remove the edges that turned one poisoned package into access across thousands of software supply chains.
Mapping an environment used to take an intrusion team days of manual reconnaissance. AI agents now compress that work into automated loops that enumerate assets, test credentials, and pursue the next hop without waiting for a human.
MITRE ATT&CK now catalogs the first documented case as Campaign C0062. A China-nexus espionage actor used an AI coding agent to run reconnaissance, vulnerability discovery, exploitation, lateral movement, credential harvesting, and exfiltration against roughly 30 organizations.
Anthropic, whose Claude Code agent the attackers manipulated, reported that the AI executed 80% to 90% of tactical operations, with human operators approving progress at a handful of decision points. The same report noted the agent hallucinated credentials in some cases, a limit that slowed but did not stop the campaign.
Defenders now face the same graph at machine speed, with less warning. Paths that once took an operator weeks to find surface in hours, which moves the value of attack path analysis from periodic assessment to continuous discovery.
Most of these limits trace back to incomplete or internal-only data. Pairing internal graphs with external exposure, credential, and adversary intelligence closes the gap where many real intrusions begin, including those run by advanced persistent threat groups.
Continuously, with re-analysis after significant changes such as new deployments, permission updates, acquisitions, or newly exploited vulnerabilities.
Blast radius is the set of assets an attacker reaches from a single compromised node, used to estimate the impact of one foothold.
No. Most tools build graphs from APIs, directory queries, cloud configurations, and scan data, though some add endpoint agents for session and credential data.
Yes, with reduced accuracy. External discovery and cloud APIs fill gaps, and missing assets remain the largest source of blind spots.
A kill chain describes the generic stages of an intrusion. An attack path is a specific route through one organization's assets and relationships.
Vulnerability management, exposure management, identity, and cloud security teams run it, and red teams and SOC analysts consume the results.
Most attack path analysis starts inside the network and works outward from the inventory. CloudSEK starts from the other end, with the initial access vectors that exist before an attacker touches internal systems.
CloudSEK Nexus AI correlates signals from digital risk, threat actor activity, the external attack surface, AI systems, and third-party ecosystems into a unified attack graph. It shows how a leaked credential, an exposed asset, or a supplier compromise chains toward critical assets, and ranks each path by exploitability and attacker behavior.
Working from external exposure changes when paths become visible. Routes surface while they are still reconnaissance targets, and the choke point that breaks the most routes gets fixed before any of them are exploited.
