🚀 أصبحت CloudSek أول شركة للأمن السيبراني من أصل هندي تتلقى استثمارات منها
اقرأ المزيد


API monitoring is the continuous validation of application programming interface (API) endpoints for availability, performance, and payload correctness in production. API monitoring confirms 3 things at once: the endpoint answers, the answer arrives fast, and the answer contains the right data.
Exposed APIs show what’s at stake. CloudSEK’s BeVigil found unauthenticated API endpoints at a major technology service provider that exposed the records of more than 33,000 employees, including personal details, asset configurations, and internal project information, to anyone who sent a simple request. Without authentication, endpoints like these become open doors to data theft, social engineering, and further attacks.
Modern architectures raise those stakes further. Microservices communicate through internal APIs, partners integrate through external ones, and API-as-a-product businesses bill for the endpoint itself, which turns every unmonitored interface into unpriced risk.
API monitoring validates 3 layers, and each layer catches failures the previous one misses. Availability checks validate the endpoint is reachable, performance checks validate the response arrives within acceptable latency, and correctness checks validate the payload carries the expected structure and values.
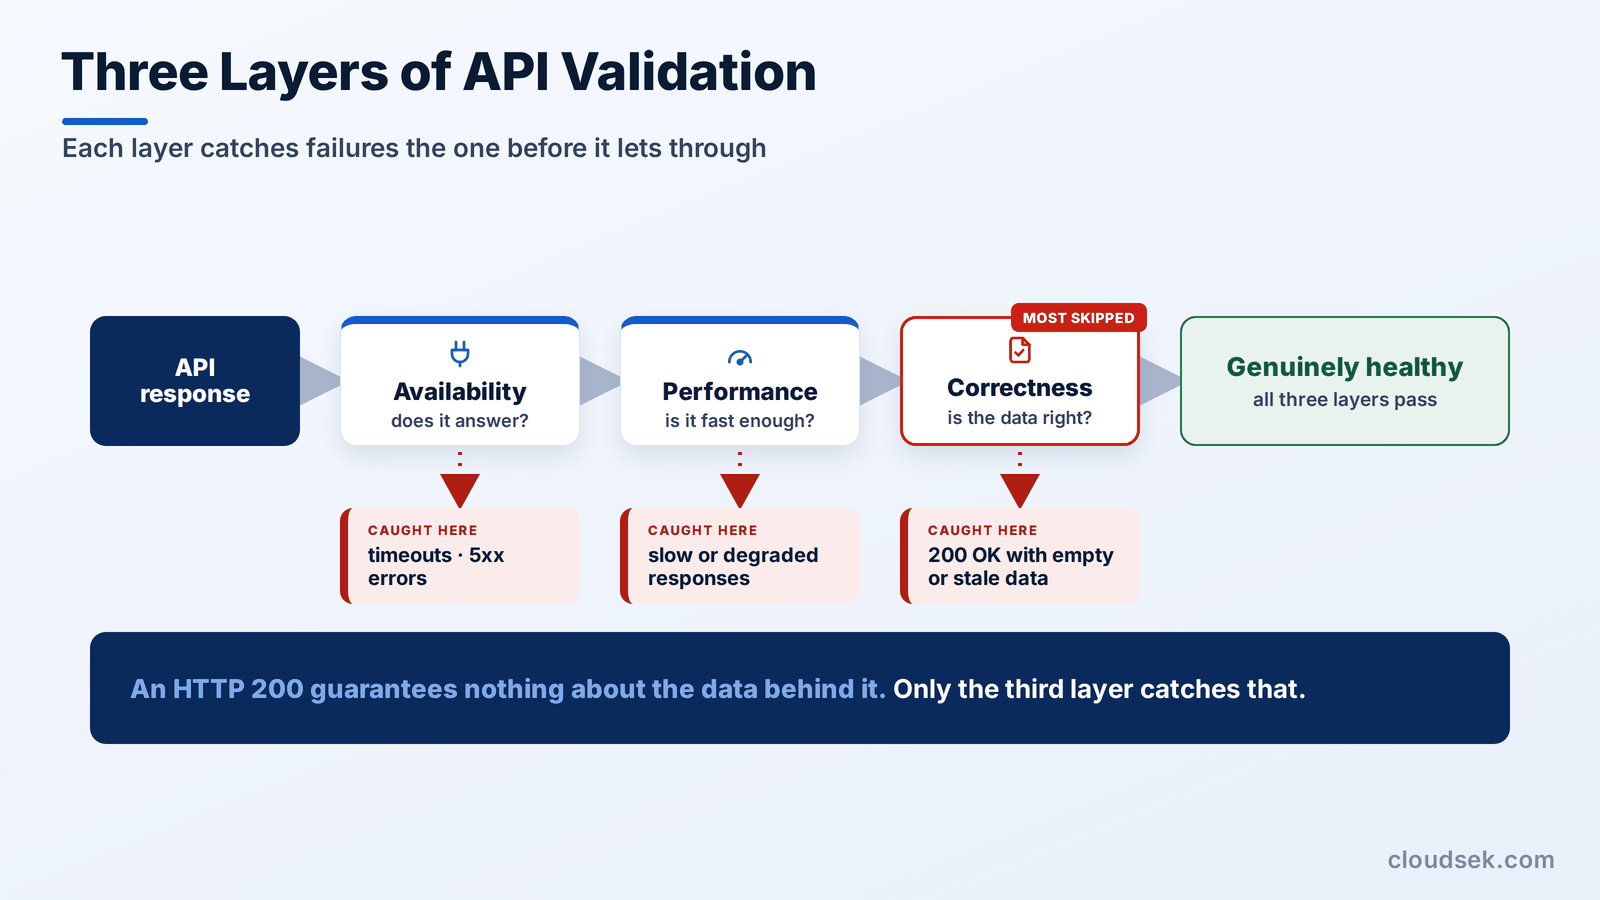
Correctness is the layer teams skip at their own cost. An HTTP 200 status code guarantees nothing about the data behind it: a degraded upstream dependency returns 200 with empty, stale, or malformed payloads, a failure pattern practitioners call the illusion of availability. Payload assertions on fields, formats, and values close that blind spot.
API monitoring works through a repeating check loop that a monitoring agent executes against each endpoint. Six steps make up one cycle:
Method-wise, the loop is active monitoring; the approach tools market as synthetic monitoring: the checks manufacture their own traffic. Real user monitoring (RUM) scripts, gateway logs, and load balancer telemetry cover the passive side by observing what genuine consumers experience, and the split between the 2 approaches carries its own trade-offs in active vs. passive monitoring. Credential handling deserves care inside the loop, since expiring OAuth (open authorization) tokens produce false alerts whenever monitors skip automatic token refresh.
Eight metrics carry the signal in API monitoring, and the healthy target for each depends on endpoint criticality. Google’s site reliability engineering guidance compresses monitoring into 4 golden signals, latency, traffic, errors, and saturation, and the API metric set below maps onto them directly.
Static thresholds mislead more than they help. A 400 ms response is an outage signal for a cached product lookup and normal behavior for a report generator, so mature teams derive alert lines from each endpoint’s own baseline rather than borrowing universal numbers.
Targets harden into commitments through 2 further terms. A service level indicator (SLI) is the measured value itself, and a service level objective (SLO) is the internal goal teams hold, set stricter than the customer-facing SLA so breaches surface internally first.
Seven types of API monitoring cover the ground between a simple reachability check and a security investigation:
Transaction monitors chain sequential API calls into one multi-step flow that mirrors a real user journey. A checkout flow runs authenticate, fetch product, add to cart, initiate checkout, and charge payment as 5 dependent steps, with tokens, cart identifiers, and session values extracted from each response and injected into the next request.
Chaining exposes what single-endpoint checks structurally miss. Five endpoints reporting green individually still add up to one broken journey when a token expires mid-flow or a step returns 200 with a declined status in the body. Assertion runs across the whole sequence, and each step pinpoints where the transaction died.
Third-party APIs demand their own monitors because failure attribution decides the response. A dedicated check on the payment, identity, or shipping provider answers the first incident question, ours or theirs, in seconds, and the recorded history doubles as evidence when a vendor’s delivery drifts from the SLA it sold.
Internal APIs deserve equal coverage even though they never face the public internet. Service-to-service calls inside private networks cause the cascading failures that surface as frontend errors, and agents deployed inside the network boundary run the same check loop against them without opening inbound firewall rules.
Timing is the difference between API monitoring and API testing: testing runs before deployment to prevent defects, while monitoring runs after deployment to detect failures. Testing exercises edge cases and error paths inside controlled environments, and monitoring watches critical paths under real infrastructure, real traffic, and real dependency behavior.
Disciplined teams treat the 2 practices as one pipeline. Test collections written during development convert into production monitors at release, and monitoring-as-code workflows version those monitor definitions next to application code, which keeps requests defined once and closes the gap between what was tested and what is watched.
Security widens API monitoring from watching health to watching intent. Attackers probe the same endpoints operations teams measure, and 3 exposure classes dominate the risk. Regulated industries layer compliance checks, from TLS versions to data-handling evidence, onto the same signals, and monitoring pipelines carry redaction duties of their own, since captured requests hold tokens and personal data.
Attack traffic announces itself in patterns before it lands in breaches. Authentication failure spikes signal credential stuffing, sequential identifier requests reveal enumeration and scraping, and traffic bursts from a single origin betray automated abuse.
Baselines turn those patterns into alerts. OWASP’s API Security Top 10 catalogs the weakness classes the signals map onto, with broken object level authorization and broken authentication holding the first 2 positions. Monitoring rules tuned to those classes catch exploitation attempts that performance dashboards score as ordinary load. In one CloudSEK case study, BeVigil identified an authorization flaw in the API of a major wearable device platform that could have exposed millions of users’ data, and the issue was fixed before it was exploited.
A shadow API is an endpoint running in production without appearing in any inventory, and a zombie API is a deprecated version left alive after its replacement shipped. Neither carries monitors, patches, or authentication reviews, which makes both a standing invitation for the attackers who enumerate exposed interfaces from the outside.
Discovery closes the gap from the same outside vantage. Continuous attack surface management programs enumerate an organization’s internet-facing endpoints from the attacker’s vantage, then feed the findings back into the monitored inventory, converting unknown interfaces into watched ones.
Hardcoded and leaked keys skip the exploit entirely and hand attackers authenticated access. CloudSEK’s BeVigil research team scanned the 10,000 most-installed Android apps in April 2026 and found 32 live hardcoded Google API keys across 22 applications. Combined installs across those apps pass 500 million, and each exposed key granted unauthorized access to Gemini AI endpoints. The keys had been embedded for ordinary services such as Maps and Firebase. Once Gemini was enabled on the same Google Cloud project, they quietly gained access to it, and in one app BeVigil confirmed that user-uploaded files were exposed.
Keys leak through predictable channels: hardcoded strings in mobile app packages, committed secrets in public repositories, and configuration files in exposed storage buckets. Once harvested, keys circulate through the same underground markets where leaked credentials from breaches trade, which is why secret scanning belongs inside the API security program rather than beside it. CloudSEK XVigil monitors code repositories and underground markets for an organization’s leaked keys and credentials, and AIVigil finds and validates leaked AI API keys, like the Gemini-enabled keys above, before they’re abused.
Every monitoring type above assumes the endpoint inventory is known, and attackers make the opposite assumption. Reconnaissance starts from the internet and enumerates whatever an organization actually exposes, which routinely includes API endpoints no dashboard lists.
CloudSEK’s BeVigil works from that same outside-in vantage. BeVigil fingerprints an organization’s internet-facing infrastructure and scans APIs as one of 8 external surfaces, alongside web applications, mobile applications, cloud, known CVEs, DNS, SSL, and network, surfacing shadow endpoints, misconfigurations, and hardcoded keys before an attacker finds them. More than 600 tag classifiers and query filters keep findings tied to exposures that matter rather than raw noise.
Boundaries stay clear in this pairing. External discovery feeds the endpoint inventory that synthetic checks and telemetry pipelines depend on; the performance loop itself stays with observability tooling, and internal service-to-service traffic sits outside what external scanning sees.
To build an API monitoring practice that holds up, teams apply 8 habits that separate signal from noise.
No, API monitoring is not the same as APM (application performance monitoring). API monitoring validates endpoints from the outside, the way consumers reach them, while APM instruments application internals such as code execution, database queries, and memory.
Yes, GraphQL needs a different API monitoring approach. GraphQL servers answer through a single endpoint and typically return HTTP 200 even on failed queries, so monitors assert on the errors array and data fields inside the response body.
Uptime of 99.9% allows roughly 8.77 hours of downtime per year, 43.8 minutes per month, or 10.1 minutes per week. Four nines, 99.99%, shrinks the yearly budget to about 52.6 minutes.
Yes, API monitoring checks count against rate limits like any other request. Check volume multiplies across locations, frequency, and steps per run, so teams budget monitor traffic and whitelist monitoring IP ranges where providers allow it.
API monitoring validates the data endpoints behind an application, while website monitoring validates the rendered page a visitor sees, covering load time and visual completeness. Paired together, one finds the cause, and the other confirms user impact.
An Apdex score is an index between 0 and 1 that grades user satisfaction with response times, weighing satisfied, tolerating, and frustrated requests against a target threshold. Scores above 0.94 indicate strong performance.
