🚀 أصبحت CloudSek أول شركة للأمن السيبراني من أصل هندي تتلقى استثمارات منها
اقرأ المزيد
.avif)

Threat intelligence effectiveness is measured through KPIs that reflect how fast threats are detected, how accurately they are identified, and how efficiently responses are executed. Metrics such as MTTD, MTTR, dwell time, and false positive rate provide a direct view of security performance.
Detection delays and response gaps become visible only when these metrics are consistently tracked and analyzed. Security teams use these insights to reduce alert noise, improve prioritization, and respond to real threats with greater precision.
Changing attack patterns and increasing data volumes require continuous evaluation of intelligence processes. KPI-driven measurement keeps threat intelligence aligned with operational needs and supports stronger, more adaptive security outcomes.
KPIs provide measurable insights that help evaluate and improve threat intelligence operations.
Threat intelligence KPIs are measured by tracking how intelligence improves detection speed, response efficiency, accuracy, and risk reduction across the security lifecycle.
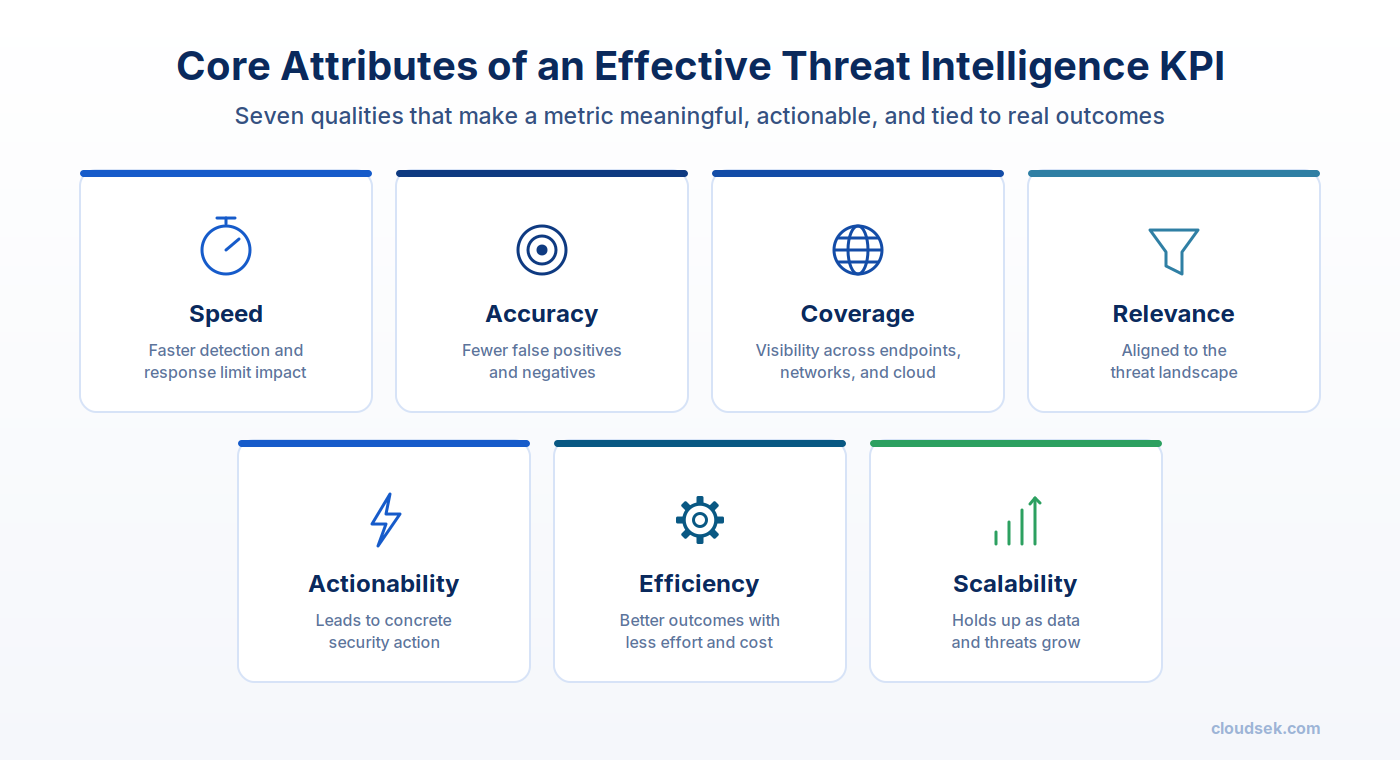
Effective threat intelligence KPIs are defined by attributes that ensure measurements are meaningful, actionable, and aligned with real security outcomes.
Security teams rely on defined KPIs to understand whether intelligence reduces risk, improves detection, and supports faster response across real attack scenarios.
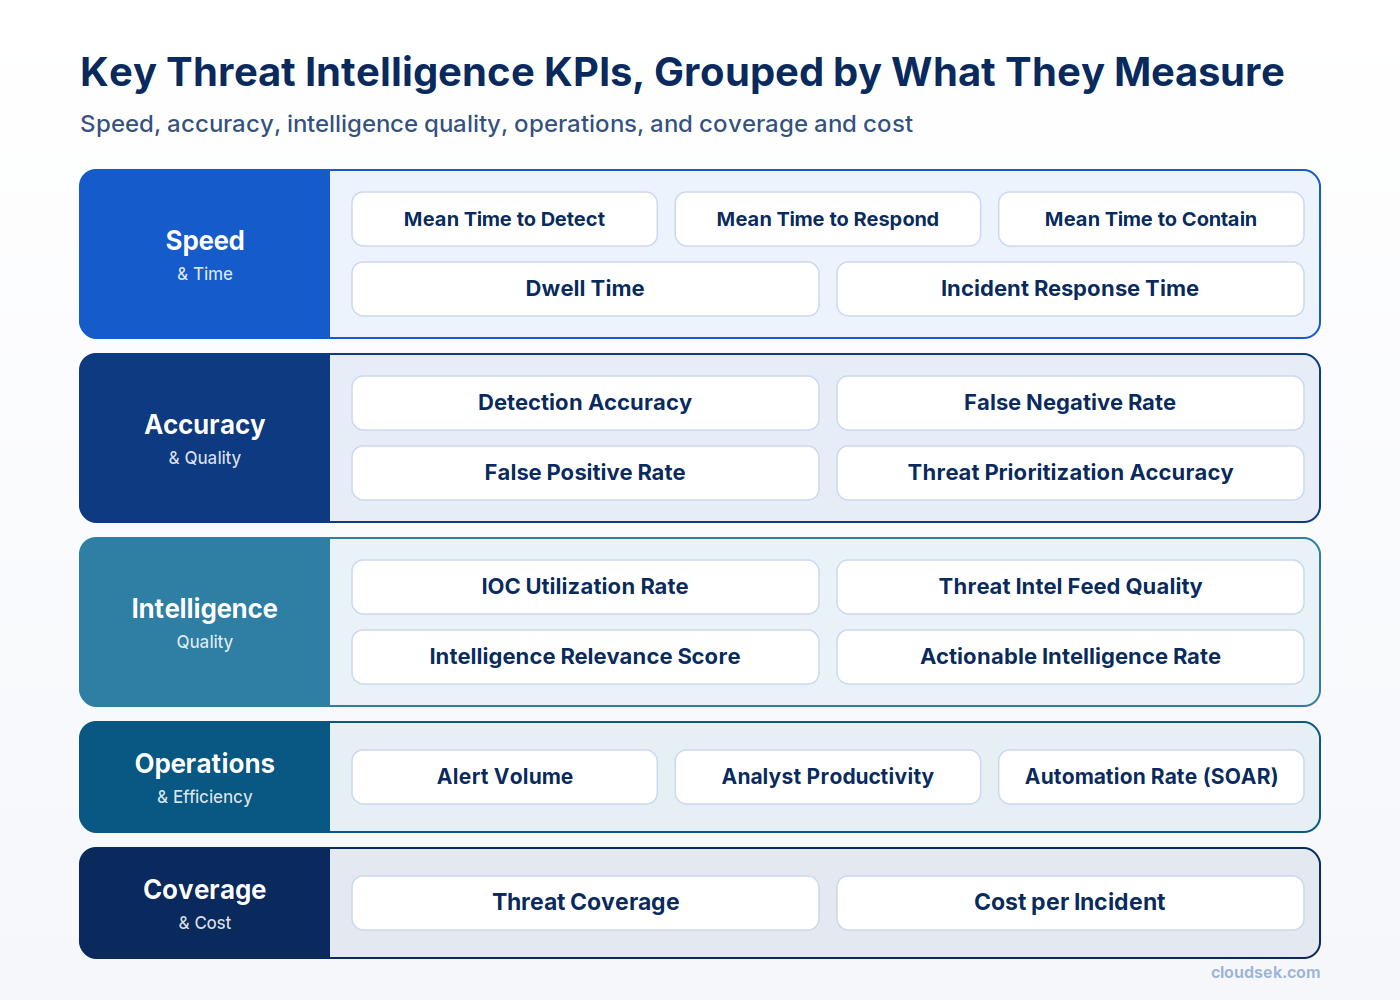
Detection speed reflects how quickly malicious activity becomes visible across SIEM pipelines, endpoint telemetry, and network traffic analysis. Delays allow threats such as ransomware or lateral movement to expand before containment begins.
Log ingestion latency, correlation rules, and anomaly detection models directly influence this metric. Continuous threat hunting and mapping activity to MITRE ATT&CK techniques improves visibility across early-stage intrusion patterns.
Dwell time represents the duration an attacker maintains access before discovery. Extended presence often signals gaps in monitoring across cloud assets, endpoints, or exposed attack surface areas.
Credential misuse, persistence mechanisms, and stealth techniques aligned with Cyber Kill Chain phases often remain hidden without behavioral analysis. Reduced dwell time indicates strong detection coverage and active investigation workflows.
Accuracy reflects how precisely malicious activity is identified without misclassification. Poor accuracy leads to missed threats or excessive noise that disrupts investigation focus.
Balanced tuning across detection rules, behavioral analytics, and intelligence correlation improves signal reliability. High accuracy becomes critical during attacks involving credential theft, where subtle indicators often blend with normal activity.
Missed detections expose critical blind spots across monitoring systems. Undetected threats often escalate into data breaches or long-term persistence inside infrastructure.
Gaps in intelligence feeds, outdated detection logic, and incomplete telemetry increase failure rates. Continuous validation using known indicators of compromise and adversary behaviors strengthens detection coverage.
Response duration reflects how quickly security teams act after detection triggers an alert. Delayed action allows attackers to escalate privileges or exfiltrate sensitive data.
Playbooks, escalation workflows, and integration with automated response systems directly influence execution speed. Faster response reduces impact across incidents involving phishing campaigns or unauthorized access attempts.
Containment speed determines how quickly threats are isolated from critical systems. Slow containment increases the risk of propagation across interconnected assets.
Segmentation controls, endpoint isolation capabilities, and coordinated response workflows improve containment performance. Strong alignment between detection and action limits attacker movement within the environment.
Total response duration measures the time from detection to full resolution. Longer timelines often indicate process gaps, unclear ownership, or fragmented tooling.
Centralized workflows and coordinated actions across detection and response systems improve resolution cycles. Reduced response time minimizes operational disruption and limits financial impact.
Prioritization reflects how correctly threats are ranked based on severity and potential impact. Misjudged prioritization delays response to high-risk incidents.
Risk scoring models that incorporate asset criticality, attack stage, and threat intelligence context improve decision-making. Accurate prioritization ensures focus remains on high-impact threats rather than noise.
Utilization measures how effectively intelligence indicators are applied across detection systems. Low usage indicates a disconnect between intelligence collection and operational deployment.
Frequent updates and alignment with detection pipelines improve relevance. Integration of Indicators of Compromise across monitoring systems strengthens detection consistency.
Feed quality reflects reliability, freshness, and contextual relevance of intelligence sources. Poor-quality feeds introduce noise and reduce trust in alerts.
Validation against real attack patterns and mapping to tactics, techniques, and procedures improves intelligence value. High-quality feeds support accurate detection and actionable insights.
Relevance reflects alignment between intelligence and an organization’s risk profile. Irrelevant data increases investigation overhead and distracts from critical threats.
Context-aware filtering based on industry, geography, and attack patterns improves precision. Targeted intelligence supports faster decision-making and focused mitigation.
Actionable intelligence measures how often insights lead to direct security actions. Low actionability signals a weak connection between intelligence and execution.
Operational alignment between analysis and response workflows increases impact. Intelligence that drives containment, blocking, or remediation delivers measurable value.
Alert volume reflects the number of generated security events requiring investigation. Excessive alerts overwhelm analysts and reduce response efficiency.
Noise often results from poorly tuned detection rules or low-quality intelligence inputs. Balanced alert generation supports manageable workloads and focused analysis.
False positives represent alerts incorrectly flagged as threats. High rates reduce trust in detection systems and slow investigation workflows.
Refined correlation logic and improved intelligence filtering reduce unnecessary alerts. Lower false positives improve analyst focus and investigation speed.
Productivity reflects output relative to workload across security operations. Low productivity often signals inefficiencies in workflows or excessive manual effort.
Automation, streamlined processes, and improved intelligence quality support higher throughput. Reduced noise enables analysts to focus on high-value investigations.
SOAR platforms measure how many tasks are executed through automated workflows. Higher automation reduces manual intervention across repetitive processes.
Integration with response playbooks and orchestration systems improves consistency. Automated containment and response actions accelerate mitigation timelines.
Coverage reflects visibility across endpoints, networks, cloud assets, and external exposure. Limited coverage leaves gaps that attackers can exploit.
Expanded monitoring across the attack surface improves detection reach. Strong coverage reduces the likelihood of undetected intrusion paths.
Cost per incident measures financial impact associated with detection, response, and recovery. High costs often indicate inefficiencies in workflows or delayed action.
Optimized detection and response processes reduce resource consumption and downtime. Lower incident costs reflect stronger operational control and faster containment.
Threat intelligence effectiveness depends on how well KPIs translate data into measurable improvements across detection and response workflows. Consistent tracking of metrics such as MTTD, MTTR, and detection accuracy provides clear visibility into performance gaps and operational strengths.
Strong KPI frameworks enable security teams to reduce noise, improve prioritization, and respond to threats with greater precision. Alignment between intelligence, tools, and workflows ensures that insights lead to real actions rather than remaining theoretical measurements.
Continuous evaluation of these KPIs supports adaptation to evolving attack techniques and growing data complexity. Organizations that rely on structured measurement can maintain resilience, reduce risk exposure, and improve overall security outcomes over time.
